• thinkigcse.com

Breakeven Charts

These are graphs which show how costs and revenues of a business change with a change in sales. They show the level of sales the business must make in order to break even.

Criticism of break even analysis

Fixed cost is represented as a straight line but in actual fixed costs is likely to change at different levels of output. A stepped line may represent fixed cost more accurately.

Important terms

Fixed cost: all costs which do not change with the change in output. Example rent, interest charges.

Variable cost: all costs which change with the change in output. Example materials, fuel and labour cost.

Total cost= fixed cost + variable cost

Revenue: income from sales of goods and services (Quantity sold X Price)


Breakeven point is that level of output where the sales revenue is equal to the total cost. That level of output where there is no profit or loss. If a business is unable to reach this level of output it will suffer a loss from this product. Any output in excess of break even generates profit for the company.

Margin of Safety: The horizontal distance between the breakeven level of output and the current level of output is known as margin of safety.
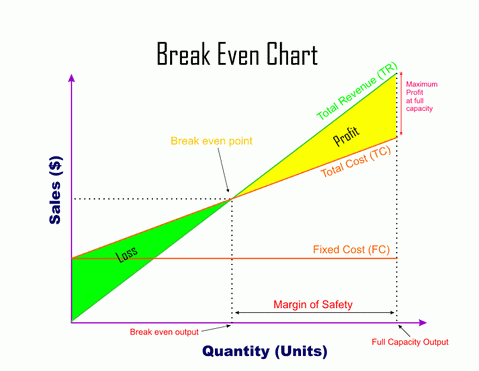
break even chart


Method of plotting Break even chart

  • Calculate fixed cost, total cost and Sales at different levels of output in a table
  • Plot the Sales on X axis, Output on Y axis
  • Plot fixed cost from the table
  • Plot total cost from the table
  • Plot sales from the table
  • The point at which the sales (total revenue TR) line crosses the total cost (TC) line is the breakeven point.
  • Breakeven point can be expressed in Output as well as in Value.

Exciting News!

IMPORTANT MESSAGE

Quizzes and worksheets on this website have been developed in Flash format. Flash is no more supported by browsers. Therefore, you might see blank pages on some instances. Install Flash player plugin for Chrome from Chrome Web Store. Click here 

Similarly, for other web browsers you will have to activate the relevant flash player plugins.

JOIN OUR ONLINE COURSES

New Youtube Channel - ThinkIGCSE

Hi Everyone, I have launched a new YouTube channel with more than a 100 videos on  Economics and Business Studies, tailored specifically for IGCSE and A Level and IBDP students.

Subscribe now and join us on this learning journey: @thinkIGCSE

WHO'S ONLINE

We have 118 guests and no members online

MindMaps

PDF FILE

Download

Cheatsheets

PDF FILE

Download

Crosswords

PDF FILE

Download

Save
Cookies user preferences
We use cookies to ensure you to get the best experience on our website. If you decline the use of cookies, this website may not function as expected.
Accept all
Decline all
Read more
Analytics
Tools used to analyze the data to measure the effectiveness of a website and to understand how it works.
Google Analytics
Our website uses Google Analytics to understand how you interact with our site and improve your browsing experience. These cookies collect information in an anonymous form, including the number of visitors to the site, where visitors have come from, and the pages they visited. The data helps us analyze trends and user behavior to enhance our website's functionality and content.
Accept
Decline
Marketing
Set of techniques which have for object the commercial strategy and in particular the market study.
Marketing
Our website uses Google marketing cookies to deliver personalized ads and measure the effectiveness of our advertising campaigns. These cookies track your online activity to help us show you relevant ads on Google services and partner websites.
Accept
Decline