Breakeven Charts
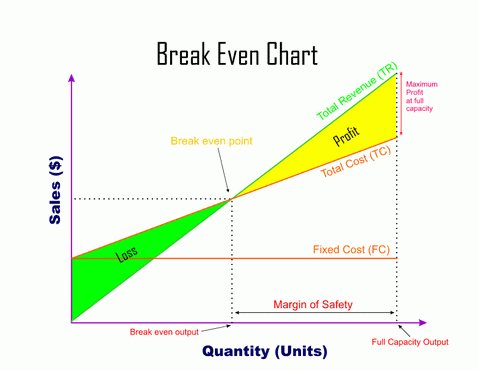
These are graphs which show how costs and revenues of a business change with a change in sales. They show the level of sales the business must make in order to break even.
Criticism of break even analysis
Fixed cost is represented as a straight line but in actual fixed costs is likely to change at different levels of output. A stepped line may represent fixed cost more accurately.
Important terms
Fixed cost: all costs which do not change with the change in output. Example rent, interest charges.
Variable cost: all costs which change with the change in output. Example materials, fuel and labour cost.
Total cost= fixed cost + variable cost
Revenue: income from sales of goods and services (Quantity sold X Price)
Breakeven point is that level of output where the sales revenue is equal to the total cost. That level of output where there is no profit or loss. If a business is unable to reach this level of output it will suffer a loss from this product. Any output in excess of break even generates profit for the company.
Margin of Safety: The horizontal distance between the breakeven level of output and the current level of output is known as margin of safety.

Method of plotting Break even chart
- Calculate fixed cost, total cost and Sales at different levels of output in a table
- Plot the Sales on X axis, Output on Y axis
- Plot fixed cost from the table
- Plot total cost from the table
- Plot sales from the table
- The point at which the sales (total revenue TR) line crosses the total cost (TC) line is the breakeven point.
- Breakeven point can be expressed in Output as well as in Value.